

Campbell, California州、2011年11月8日-市場調査会社Infonetics Researchは「Service Provider Capex, Opex, ARPU, and Subscribers」からの抄録を発表した。これは、通信キャリアの資本的支出 (Capex)、事業運営費 (Opex)、加入者1人当たりの収益、そして加入者傾向を、通信事業者や通信事業者タイプ、地域、また通信機器部門別に分析しているものである。
アナリストノート
「2011年に、世界の通信キャリアCapexが前年を抜き6%近く伸びると予測されるのは、主としてAT&TのLTE普及、HSPA+のアップグレード、そしてトラフィックオフロードを目的としたWi-Fiスポットへの投資によるものだ。これは今年初めにLTE展開のピークを迎えたことによるVerizon Wirelessの減速しつつあるモバイル支出を相殺する。EMEA地域においては、アフリカのCapex急上昇はギリシャ、イタリア、ハンガリーにおける通信投資の遅れを部分的に相殺する。アジア太平洋は安定した状態を保つ。カリブ海と中南米およびメキシコ (CALA) では加入者のうち75%を占めているAmerica MovilとTelefonicaの2つの通信大手は、2014年のサッカー・ワールドカップと2016年のオリンピックを主催するためのインフラ準備をしている」とInfonetics Research社のモバイル及びFMCインフラ担当主席アナリストであるStephane Teral氏は述べる。
Teral氏はまた「ヨーロッパを麻痺させている国家財政危機は、我々の通信Capex予測には今後もほとんど影響を与えないという見方を我々は維持している。通信の信用枠が正当な価格で継続する限り、進行中の国家財政危機は通信機器支出にはほとんど影響がないはずだ。世界中の投資計画は、モバイルブロードバンドとFTTxは引き続き最重要となることを示唆している」とも話す。
CAPEX報告のハイライト
- 2005年から2015年の10年間で、通信サービスプロバイダ収益は2009年を除いて毎年、前年よりも増加を見せており、これからも増加を維持していく。
- 2010年には2009年比4.1%増加したのに続き、通信サービスプロバイダ収益は2011年に7.6%上がり1兆8600億ドルになる見通し。
- 通信キャリア収益はモバイルブロードバンドに後押しされ、2015年には2兆1700億ドルに成長するとInfoneticsは予測。
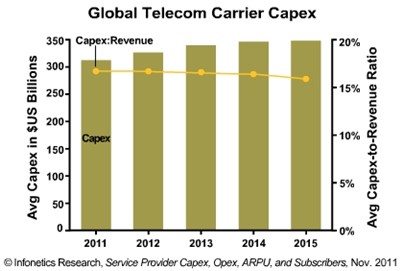
- Infoneticsは、世界の通信キャリアcapexは2011年に、2010年比で5.8%上昇して合計3108億ドルになると予測。
- 全タイプの次世代通信機器におけるサービスプロバイダ支出は、TDM voiceが予想通り2011年に上昇すると予測。
- 2011年において通信キャリアの中でも急成長中の投資エリアは、WiMAX機器 (+27.5%) とビデオインフラ (+20.7%)。
- 最大級の投資エリアはノンテレコム/データコム機器 (ソフトウェア、不動産、労働等) とモバイルインフラで、これらへの世界的支出は2011年に前年比でそれぞれ7%と8.6%上昇している。
- 2010年に収益で世界最大の通信事業者であったChina Mobileに後押しされて、アジア太平洋は2015年まで引き続いて最大通信キャリアCapex地域を維持する見通し。
- ワイヤレス専門事業者は2015年までにすべての通信キャリアCapexの1/3近くを占めるまでに成長する見通し。
Infonetics' capex reports track revenue, Capex, capital intensities (capex-to-revenue ratios), opex, ARPU, subscribers, and access lines of public and semi-private/government-owned service providers in North America, EMEA (Europe, Middle East, Africa), Asia Pacific, CALA, and worldwide. Together, the reports provide historical data, forecasts, market drivers, analysis, trends, demographics, and the ability to analyze data by service provider, service provider type, and equipment category. Categories tracked: CPE, non-telecom/data network equipment, and network infrastructure equipment (broadband aggregation, mobile, WiMAX, IP routers and carrier Ethernet switches, optical, IP voice, TDM voice, video, other telecom equipment).
RELATED RESEARCH AND EVENTS
- Mobile broadband subscribers overtake fixed broadband
- Comeback seen in telecom/datacom equipment and software market, steady growth ahead
- Satellite video, IPTV gaining fast on cable video; Netflix, Amazon threat insignificant so far
- 2G, 3G, 4G mobile gear up 25% YoY, up 5% in 2Q11; LTE surpasses WiMAX
- Client Conference Call: Service Provider Capex, Opex, ARPU, Subscribers: Dec. 1, 9:00 a.m. PT
- Latest Service Provider Capex and Subscribers newsletter: http://bit.ly/uN4CAa
Telecom capex up 6% to $311 billion in 2011, revenue up 8% to $1.86 trillion, driven by mobile broadband
Campbell, CALIFORNIA, Nov. 8, 2011-Market research firm Infonetics Research today released excerpts from its Service Provider Capex, Opex, ARPU, and Subscribers report, which analyzes telecom carrier capital expenditures (capex), operational expenses (opex), revenue per user, and subscriber trends by operator, operator type, region, and telecom equipment segment.
ANALYST NOTE
"The near-6% increase in global telecom carrier capex we expect in 2011 over 2010 is due in large part to AT&T's ramping LTE deployments, HSPA+ upgrades, and investments in WiFi hotspots for traffic offload. This offsets Verizon Wireless' slowing mobile spending since their LTE rollout peaked earlier this year. In the EMEA region, a capex hike in Africa is partially offsetting delays in telecom investment in Greece, Italy, and Hungary; Asia Pacific remains stable; and in the Caribbean and Latin America (CALA), America Movil and Telefonica, the two telecom giants that control 75% of mobile subscribers there, are preparing their infrastructure to host the soccer World Cup in 2014 and the Olympics in 2016," asserts Stephane Teral, principal analyst for mobile and FMC infrastructure at Infonetics Research.
Teral adds: "We maintain our view that the sovereign debt crisis that is paralyzing Europe continues to have little impact on our telecom capex forecast. As long as credit remains available to telecoms at a fair price, the ongoing sovereign debt crisis should have little impact on telecommunications equipment spending. Investment plans across world regions suggest mobile broadband and FTTx is the name of the game going forward."
CAPEX REPORT HIGHLIGHTS
- In the 10 years from 2005 to 2015, telecom service provider revenue has shown and will continue to show year-over-year growth every year except in 2009
- Following a 4.1% increase in 2010 over 2009, telecom service provider revenue will grow 7.6% in 2011, to US$1.86 trillion
- Telecom carrier revenue is forecast by Infonetics to grow to US$2.17 trillion in 2015, driven by mobile broadband
- Infonetics expects global telecom carrier capex to total $310.8 billion in 2011, up 5.8% over 2010
- Service provider spending on every type of next-gen telecom equipment except TDM voice is up in 2011, as expected
- The fastest-growing investment areas among telecom carriers in 2011 are WiMAX equipment (+27.5%) and video infrastructure (+20.7%)
- The largest investment areas remain non-telecom/datacom equipment (software, real estate, labor, etc.) and mobile infrastructure, global spending for which is growing 7% and 8.6%, respectively, in 2011 over 2010
- Asia Pacific will continue to be the largest telecom carrier capex region through 2015, driven by China Mobile, which ended 2010 as the world's largest mobile operator by revenue
- Wireless pure-play operators will grow to account for nearly 1/3 of all telecom carrier capex by 2015