

Campbell, CALIFORNIA, 2012年6月18日-調査会社Infonetics Researchは、Service Provider Capex, Revenue, and Capex-by-Equipment-Type レポートからその概要を発表した。ここでは、テレコム事業者の売上と資本的支出 (capex)を分析している。事業者タイプ、地域、テレコム機器別の支出予測も分析対象としており、テレコム支出の重要なトレンドに対する知見を提供している。
アナリストノート
「2012年にはテレコムcapexの増加が見込まれているが、この背景には世界中の事業者が死に物狂いでLTE ネットワークを立ち上げたり、モバイルネットワークを近代化したり、全国的な有線ブロードバンドへの取り組みを進めるために支出を増加させている動きがある。事業者はネットワークへの投資をしなくてはならない。さもなければ消えてしまうだろう。競争があまりにも過酷だからだ」と、Infonetics Researchのモバイルインフラおよび通信経済の主席アナリストStephane Teralは述べている。
Teral の追加コメント「どの地域においても、テレコムサービスとりわけモバイルブロードバンドへの高い需要が近年における投資サイクルを勢いづけている。2012年に大規模なcapexを予定している主要事業者は、米国ではClearwire, Sprint, そして T-Mobile USA、日本では NTT DoCoMo と Softbank Mobile、韓国では and KT, LGU+, および SK telecom である。中国では最近580億ドルの経済対策パッケージが発表されており、テレコムインフラへの初期投資への資金供与がなされる。一方、 Europe's Big 5 は、最近5年間で初めて資本集約度を2%ポイント高めた。深刻な経済危機の最中にあるにもかかわらず!中南米の事業者は、2011年の支出が25%増となるなど増加しており、特にAmerica Movil とTelefonicaにおいて増加が著しい。」
キャリア事業者CAPEXのハイライト
- 世界的なテレコムキャリア事業者のcapex は2010年から3%増加して2011年に3,010億ドルとなった。
- 2011年にはネットワーク機器のそれぞれのタイプで支出が増加した。例外はTDM ボイスで、これは顕著な減少であった。
- アジア太平洋地域におけるテレコム事業者のcapexは引き続き世界最大であった。EMEA (欧州、中近東、アフリカ)がこれに続いている。
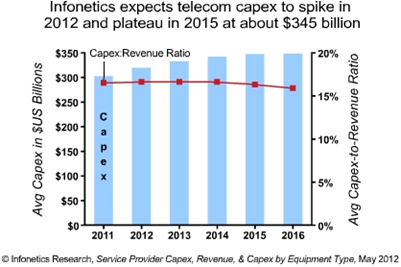
- Infonetics では、2012年にも世界的なcapexは増加すると予想しており、2015年から2016年にかけて3,450億ドル近辺で安定するとみている。
- Capexに占める無線事業者のシェアは、2012年から2016年の間に現在の4分の1から3分の1に増加すると予測している。世界全体でのモバイル化が進展していることによる。
- 2011年におけるテレコムサービス事業者の売上は2010年から 6%増加して世界全体で1.8 兆ドルとなった。
- アジア太平洋とEMEAの事業者の売上貢献が最も大きく、両地域はそれぞれ世界全体の売上の3分の1を占めている。
Infoneticsが1年に2回発行しているService Provider Capex レポートは、サービス事業者のタイプ(既存事業者、新規参入、ケーブル、独立系無線事業者)別に売上とcapexを取り扱っている。capexについては機器のタイプ(CPE、非テレコム/データ通信ネットワーク機器、IP ルーター、キャリアEthernet スィッチ、ブロードバンドアグレゲーション、無線、光通信、IP ボイス、TDM ボイス、 ビデオその他全てのテレコム/データ通信ネットワークインフラなどのネットワークインフラ)も対象としている。このレポートは世界的の主要全地域をカバーしており、2003年から2016年までのヒストリカルデータと予測、地域別・キャリアタイプ別・技術セグメント別のトレンドと予測に関する綿密な分析を行っている。
(原文)
Telecom capex spike expected in 2012; Asia is world's largest spender
Campbell, CALIFORNIA, June 18, 2012-Market research firm Infonetics Research released excerpts from its Service Provider Capex, Revenue, and Capex-by-Equipment-Type report, which analyzes telecom operator revenue and capital expenditures (capex); forecasts capex by operator type, region, and telecom equipment segment; and provides insight into important telecom spending trends.
ANALYST NOTE
"We're expecting a telecom capex hike in 2012 as operators around the world ramp their spending like crazy to launch LTE networks, modernize their mobile networks, and carry out national wireline broadband initiatives. Operators have to invest in their networks or they'll disappear -- competition is too cut-throat not to," notes Stephane Teral, principal analyst for mobile infrastructure and carrier economics at Infonetics Research.
Teral adds: "High demand everywhere for telecom services, particularly mobile broadband, is fueling the latest investment cycle. The key capex contributors in 2012 will be Clearwire, Sprint, and T-Mobile USA in the US; NTT DoCoMo and Softbank Mobile in Japan; and KT, LGU+, and SK telecom in South Korea. China recently revealed a US$58 billion economic stimulus package to fund a fresh round of investment in telecom infrastructure. Meanwhile, Europe's Big 5 have increased capital intensity by 2 percentage points for the first time in 5 years, right in the middle of the critical economic downturn! As for Latin America, operators already spiked, with capex there up 25% in 2011, led by America Movil and Telefonica."
MORE CARRIER CAPEX HIGHLIGHTS
- Global telecom carrier capex grew 3% to $301 billion in 2011 from 2010
- Spending on every type of network equipment grew in 2011, with the exception of TDM voice, which continued its steep decline
- Asia Pacific was again the largest telecom carrier capex region, followed by EMEA (Europe, Middle East, Africa)
- Infonetics expects worldwide capex to spike in 2012, then level out in 2015 and 2016 at around the US$345 billion mark
- Wireless operators' share of capex is forecast to grow from a quarter to nearly a third of global capex between 2012 and 2016, as the world continues to go mobile
- Telecom service provider revenue grew 6% to $1.8 trillion worldwide in 2011 over 2010
- Operators in Asia Pacific and EMEA are the largest revenue generators, each region with about a third of global revenue
Infonetics' biannual Service Provider Capex report tracks revenue and capex by service provider type (incumbent, competitive, cable, and independent wireless operators) and capex by equipment type (CPE, non-telecom/datacom network equipment, and network infrastructure, including IP routers, carrier Ethernet switches, and broadband aggregation, wireless, optical, IP voice, TDM voice, video, and all other telecom/datacom network infrastructure). The report covers all major world regions and includes historical data and forecasts from 2003 through 2016, and in-depth analysis with trends and predictions by region, carrier type, and technology segment.