

カリフォルニア 州キャンベル、2010年12月14日—通信事業市場調査会社 Infonetics Researchは、通信事業者の資本支出(capex)、運営費(opex)、使用者当たり収益、オペレータ毎や地域毎の加入者の傾向について最新の“Service Provider Capex, Opex, ARPU, and Subscribers” リポートを公表した。
アナリストノート
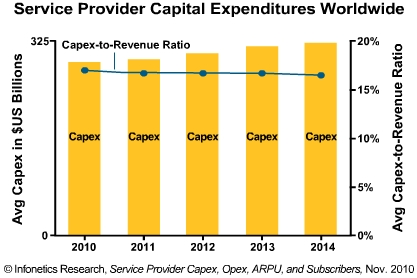
「テレコムのCapexは今年2890億米ドルでに達し、我々のサイクルベース予測モデルやサービスプロバイダとの意見交換では、新しい投資サイクルは2011年に始まって以後数年続き、成長が再び鈍化する以前にCapex は2014年に3210億米ドルまで成長するとの見通しです。世界の通信インフラの根幹は既に確立されており、爆破などによってそれらの一部を吹き飛ばしでもしない限り、資本に対するCapexの割合(資本集約度・Capital Intensity)が増加する必然性がないので、総体的には、資本集約度は少なくとも2014年までを通してゆるやかに下降を続けるでしょう」とInfonetics Researchの携帯電話とFMCインフラ部門担当主任アナリストStéphane Téralは予測する。
リポート・ハイライト
- 2008年を頂点として、世界のサービスプロバイダの Capex は2009年に5.3%下落し、2010年には更に3%の下降線を辿っている。
- 2010年のCapex の下落傾斜は、2009年にネットワークアップグレードの為に多額の投資を行った中国の通信事業者が、携帯通信事業での3Gへの投資が完了した事が主な原因。
- Infonetics Researchによると、新しい投資サイクルのスタートとして、通信事業者の2011年のCapexは1.6%回復の見込み。
- 2010年のサービスプロバイダ Capexが全体的な下降傾向であるにもかかわらず、動画インフラとIP ルータ/キャリア・イーサネットスイッチを含む通信装置分野が好調であり、2010年前半には世界市場において2桁の収益増が見られた。
- Infonetics は、2011年から2014年までの投資の主な領域が、FTTxへのブロードバンド投資、 2G モバイルネットワークの容量拡大、 2G から3G、そして LTEへのネットワーク移行であると予測する(モバイル・ブロードバンドが倣うだろう)。
- 欧米及び中国のベンダー間の過酷な価格競争による装置の低価格化が、サービスプロバイダにCapex予算を抑え、より低予算で更に多くの装置を購入を促す刺激となっている。
Infoneticsの Capexリポートは、毎月及び年2回の収益、資本集約度(設備投資-収益比)、Opex、ARPU、加入者、184の公共アクセスライン及び、セミ・プライベート/ 政府所有のサービスプロバイダの記録を追跡している。リポートは2014年までのCapexと収益の過去、現在、将来の予測データと、2010年を通しての設備予測、市場の牽引要因、分析、サービスプロバイダのシェア統計、そして分析の為にカスタマイズ可能なピボットテーブルによって提供されるサービスプロバイダ、サービスプロバイダのタイプ、設備カテゴリーのデータを含む。
本リポートはサービスプロバイダ、企業、契約者及び世界経済の為の全般的市場情勢の分析であり、Fundamental Telecom/Datacom Market Driversリポートを含む。本リポートは北米、 EMEA (ヨーロッパ、中東、アフリカ)、アジア太平洋地域、 CALA (中南米)を含む、全世界を網羅する。
(原文)
Overall telecom carrier spending to pick up in 2011 due to video, 3G, LTE investments
Campbell, CALIFORNIA, December 14, 2010—Communications industry market research firm Infonetics Research released its updated Service Provider Capex, Opex, ARPU, and Subscribers report, which analyzes telecom carrier capital expenditures (capex), operational expenses (opex), revenue per user, and subscriber trends by operator, operator type, region, and telecom equipment segment.
ANALYST NOTE
“Telecom capital expenditures are bottoming out at US$289 billion this year, and our cycle-based forecast model and conversations with service providers indicate that a new investment cycle will start in 2011 and last several years, with capex growing to US$321 billion in 2014 before growth slows again. Overall, capital intensities will continue to slowly decline through at least 2014 because the world’s telecom infrastructure is essentially built out, and unless a nuclear bomb wipes out some of it, there is no need to increase capital intensities,” expects Stéphane Téral, principal analyst for mobile and FMC infrastructure at Infonetics Research.
REPORT HIGHLIGHTS
- From its peak in 2008, worldwide service provider capex declined 5.3% in 2009, and is on track to decline another 3% in 2010
- The dip in capex in 2010 is due mainly to the fact that carriers in China, which invested heavily in network upgrades in 2009, have completed their 3G rollouts
- Infonetics Research forecasts a 1.6% pickup in telecom carrier capex in 2011, marking the start of a new investment cycle
- Despite the overall decline in service provider capex in 2010, some telecom equipment segments are faring well, including video infrastructure and IP routers/carrier Ethernet switches, which saw double-digit worldwide revenue increases in the first half of 2010
- Infonetics expects the major areas of investment from 2011 to 2014 to be fiber-based wireline broadband (FTTx), 2G mobile network capacity expansion, network migration from 2G to 3G, and migration to LTE (mobile broadband will follow)
- Low equipment pricing resulting from fierce competition between western and Chinese vendors is giving service providers incentive to cap their capex budget and buy more equipment with lower budgets
Infonetics’ capex report tracks revenue, capex, capital intensities (capex-to-revenue ratios), opex, ARPU, subscribers, and access lines of 184 public and semi-private/government-owned service providers on a monthly and biannual basis. The report includes past, current, and forecast capex and revenue data through 2014 and equipment forecasts through 2010, market drivers, analysis, service provider demographics, and customizable pivot tables to analyze data by service provider, service provider type, and equipment category.
The report includes a Fundamental Telecom/Datacom Market Drivers report with analysis of overall market conditions for service providers, enterprises, subscribers, and the global economy. Regions covered in the report include North America, EMEA (Europe, Middle East, Africa), Asia Pacific, CALA (Central and Latin America), and worldwide.