

2011年6月7日、カリフォルニア州キャンベル—市場調査会社のInfonetics Research社は今日、サービスプロバイダ Capex、Opex、ARPU、契約者レポートの抜粋を発表した。本レポートは、通信キャリアの資本支出(capex)、営業費用(opex)、契約者一人当たりの収入、契約者の動向について、オペレータ、オペレータの種類、地域、通信機器などに分類して分析を行うものである。
アナリストノート
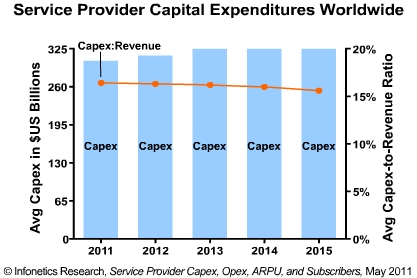
「我々が正確に予測した通り、2011年は、3~4年継続して2014年に停滞期に入ると見られる、新たな投資サイクルの始まりの年となりつつあります。ですが、興奮のし過ぎは禁物です。というのも、有線と無線のブロードバンド利用が増加中にもかかわらず、通信サービス全体の収益は著しい成長をもたらすほどの額には達しておらず、capexの成長は2006年から2008年のような二桁成長ではなく一桁成長になると見られるからです。様々な地域で行われている国を挙げたブロードバンド振興策と共に、モバイルネットワークの近代化とLTEへの移行などが、この投資サイクルを促進していくでしょう。」Infonetics Research社のモバイル及びFMCインフラ担当主席アナリストであるStéphane Téralは、このように予測する。
レポートハイライト
- 通信サービスプロバイダの資本支出は、2009年の5%低下に続いて、2010年は世界全体で3%低下、2890億ドルの最低額となった。
- 一方、通信キャリアの収益成長は回復し、2010年は1兆7200億ドルに増加、2009年と比較して3.5%の成長となった。
- Infonetics社は、キャリアによる2011年の資本支出は4.7%増加と予測している。
- 2010年は、WiMAX 機器(+42%)、IPルータ及びキャリアイーサネットスイッチ(+21%)、ブロードバンド統合機器(+7.3%)などの分野において世界のキャリアによる支出は増加したが、特に11%低下するも、依然として全キャリア支出の約40%を占めるモバイルインフラなどの影響もあり、他のネットワーク機器支出の低下を相殺するには及ばなかった。
- Infonetics社は、2011年、追跡調査している全ての通信機器部門で成長が見られると予測している。
- 2010年は収益成長が回復したが、予測期間までの間この成長は続くと見られる。
- Infonetics社が2009年に作成した、2010年の通信キャリアのcapexと収益に関する予測値は、2010年の実績値と比べ、それぞれ2.0%と0.7%の範囲に収まった。
Infonetics社のcapexレポートでは、北アメリカ、EMEA (欧州、中東、アフリカ)、アジア太平洋、CALA (中央・ラテンアメリカ)、その他の地域における、収益、capex、資本集約度(資本支出と収益の割合)、opex、ARPU、契約者、約200社の公的及び半官半民のサービスプロバイダを追跡調査している。 また、毎月及び年2回発表する本レポートでは、過去、現在、2015年までのcapexと収益、2011年までの機器売上予測、市場の成長要因、詳細な分析、サービスプロバイダの動向、そしてサービスプロバイダ、サービスプロバイダの種類、機器の種類に分類してデータを分析できるカスタマイズ可能なピボットテーブルを提供している。本サービスには、サービスプロバイダ、企業、契約者、世界経済について全体的な市場環境を分析した、通信・データ通信市場を促進する基礎的要因に関するレポートも含まれている。
(原文)
Telecom carrier revenues grew to $1.72 trillion in 2010; carrier capex to grow 4.7% in 2011
Campbell, CALIFORNIA, June 7, 2011—Market research firm Infonetics Research today released excerpts from its Service Provider Capex, Opex, ARPU, and Subscribers report, which analyzes telecom carrier capital expenditures (capex), operational expenses (opex), revenue per user, and subscriber trends by operator, operator type, region, and telecom equipment segment.
ANALYST NOTE
"As we correctly predicted, 2011 is shaping up as the first year of a new 3- to 4-year investment cycle that should lead us to a plateau in 2014. However, don’t get too excited because we’re talking about low single-digit percent capex growth, not the double-digit growth rates of 2006 to 2008, because overall telecom service revenues just aren’t there to justify significant hikes, despite increasing usage of both wireline and wireless broadband. Mobile network modernization and migration to LTE, along with national wireline broadband initiatives in various regions, will drive this investment cycle," expects Stéphane Téral, principal analyst for mobile and FMC infrastructure at Infonetics Research.
REPORT HIGHLIGHTS
- Telecom service provider capex bottomed out at $289 billion worldwide in 2010, down 3%, following a 5% decline in 2009
- Meanwhile, telecom carrier revenue growth resumed, increasing 3.5% to $1.72 trillion in 2010, a 3.5% increase over 2009
- Infonetics forecasts carrier capital expenditures to increase 4.7% in 2011
- In 2010, growth in global carrier spending on WiMAX equipment (+42%), IP routers and carrier Ethernet switches (+21%), and broadband aggregation equipment (+7.3%) was not enough to offset the declines in other network equipment spending, particularly for mobile infrastructure, which dropped 11% and still makes up about 40% of total carrier spending
- In 2011, Infonetics expects growth in all telecom equipment sectors it tracks
- Revenue growth resumed in 2010 and will continue throughout the forecast period
- Infonetics' telecom carrier capex and revenue forecasts for 2010, made in 2009, were within 2.0% and 0.7%, respectively, of actual 2010 capex and revenues
Infonetics' capex reports track revenue, capex, capital intensities (capex-to-revenue ratios), opex, ARPU, subscribers, and access lines of about 200 public and semi-private/government-owned service providers in North America, EMEA (Europe, Middle East, Africa), Asia Pacific, CALA (Central and Latin America), and worldwide. Together, the monthly and biannual reports provide past, current, and estimated future capex and revenue data through 2015 and equipment forecasts through 2011, market drivers, in-depth analysis, service provider demographics, and customizable pivot tables to analyze data by service provider, service provider type, and equipment category. The service includes a Fundamental Telecom/Datacom Market Drivers report with analysis of overall market conditions for service providers, enterprises, subscribers, and the global economy.